August 2026 Peterborough & Kawarthas Real Estate Market Report
August 2026 Peterborough & Kawarthas Real Estate Market Report
What the latest City, County, and waterfront stats mean for buyers and sellers
The August numbers show a market that became more balanced in the City, remained softer in Peterborough County, and showed somewhat stronger activity in the waterfront segment.
Across all three markets, inventory remains sufficient to give buyers choices, but the details are increasingly important. Sales slowed considerably in the City, County inventory remains elevated relative to demand, while waterfront sales actually improved from July.
This is a good example of why one headline about the "Peterborough market" does not tell the whole story. The City, County, and waterfront markets are moving differently, and buyers and sellers need to look at the segment that actually applies to their property.
City of Peterborough
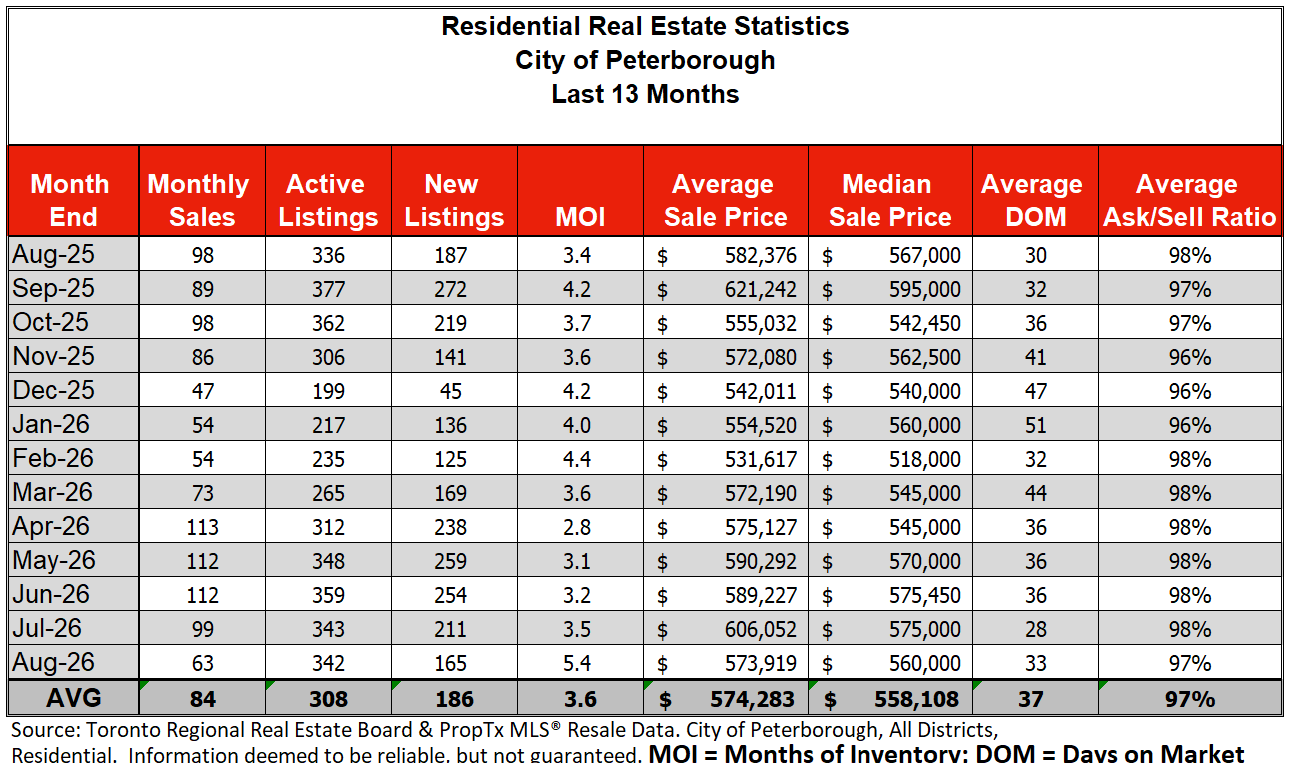
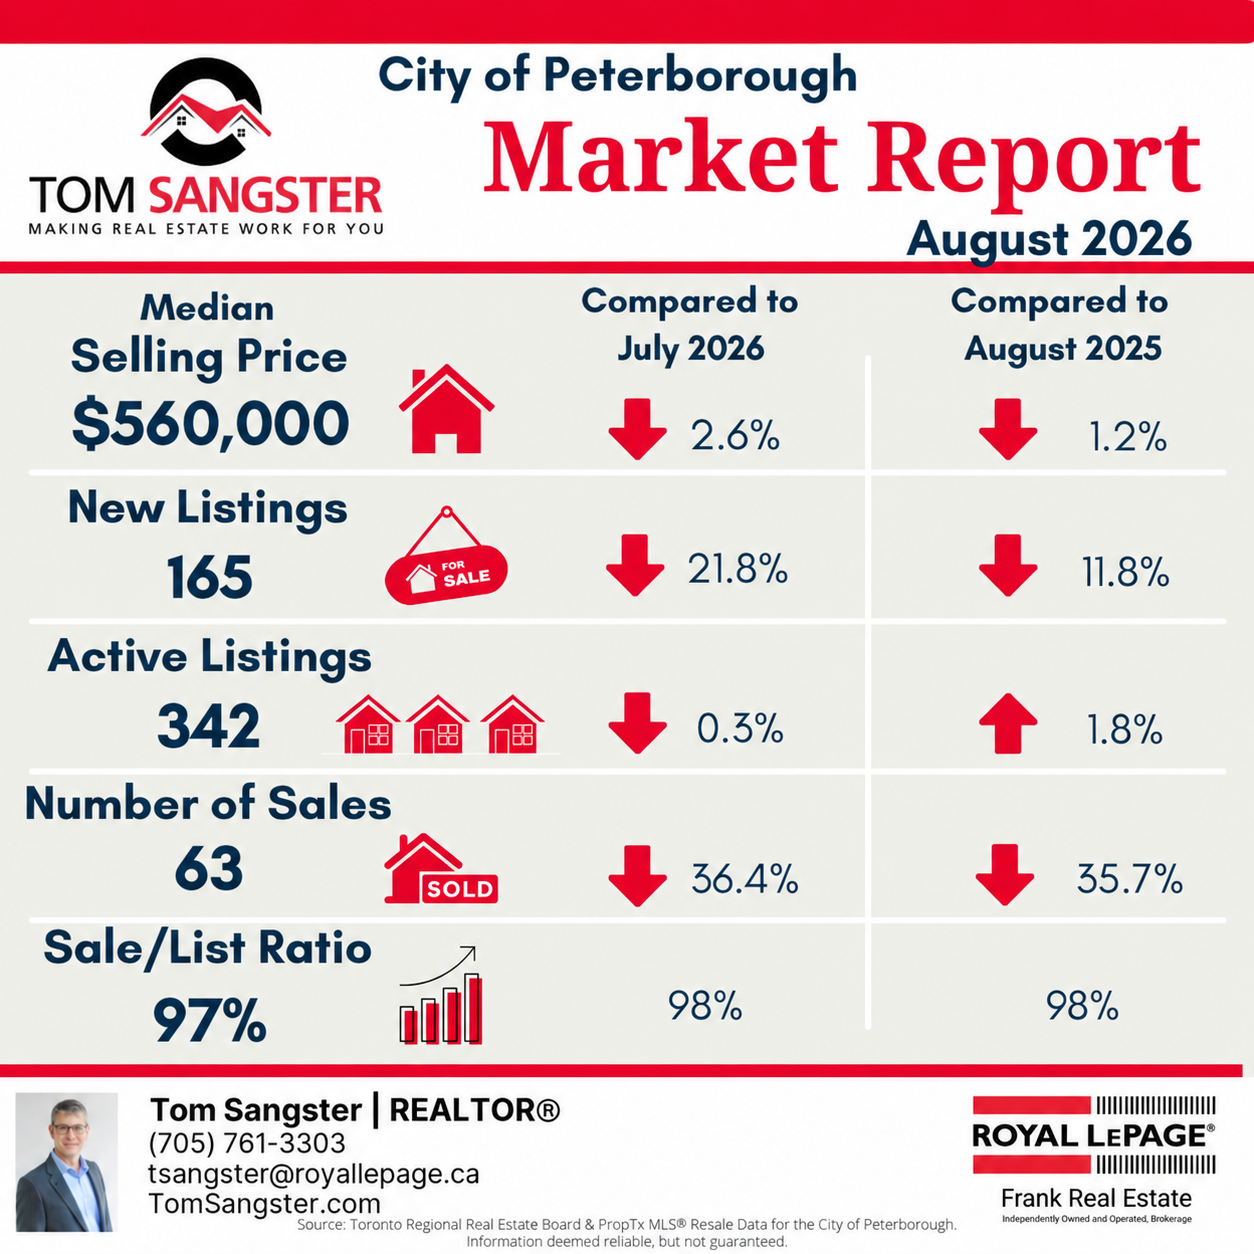
In the City of Peterborough, the median selling price for August was $560,000, down 2.6% from July and 1.2% compared to August 2025.
Sales dropped to 63, down 36.4% from July and 35.7% year-over-year. New listings also declined, falling to 165, down 21.8% from July and 11.8% compared to last August.
Active listings were relatively stable at 342, down just 0.3% from July and up 1.8% year-over-year.
The more important change is the relationship between supply and sales. Months of inventory increased to approximately 5.4 months, moving the City into a more balanced market after tighter conditions earlier in the summer.
For buyers, that means somewhat more negotiating room and less pressure to make a decision simply because inventory is limited. It does not mean every seller is highly negotiable, but buyers can generally afford to compare properties more carefully.
For sellers, August reinforces the importance of getting the price and positioning right from the beginning. The average sale-to-list ratio slipped to 97%, compared with 98% in July. Buyers are still purchasing, but they appear less willing to stretch for properties they believe are overpriced.
One month of slower sales does not establish a long-term trend, but the shift in inventory relative to demand is worth watching as we move into the fall market.
Peterborough County
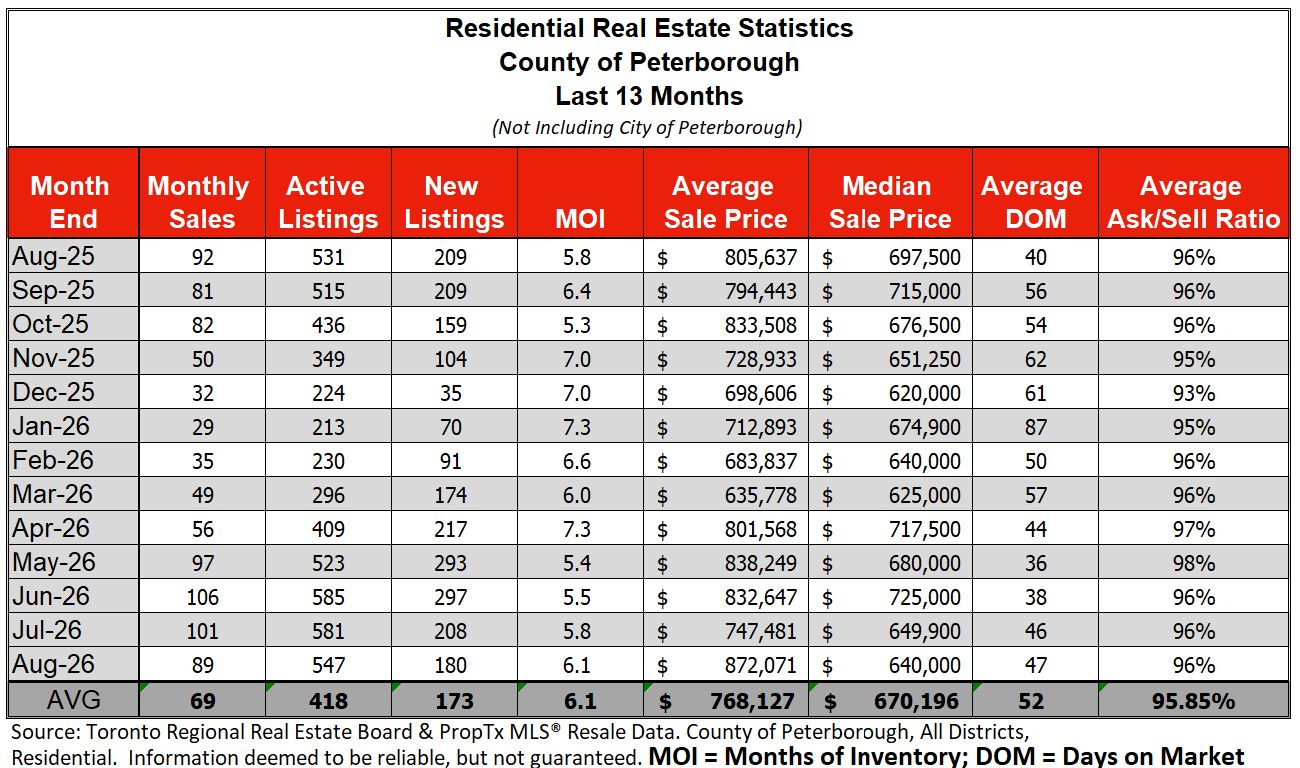
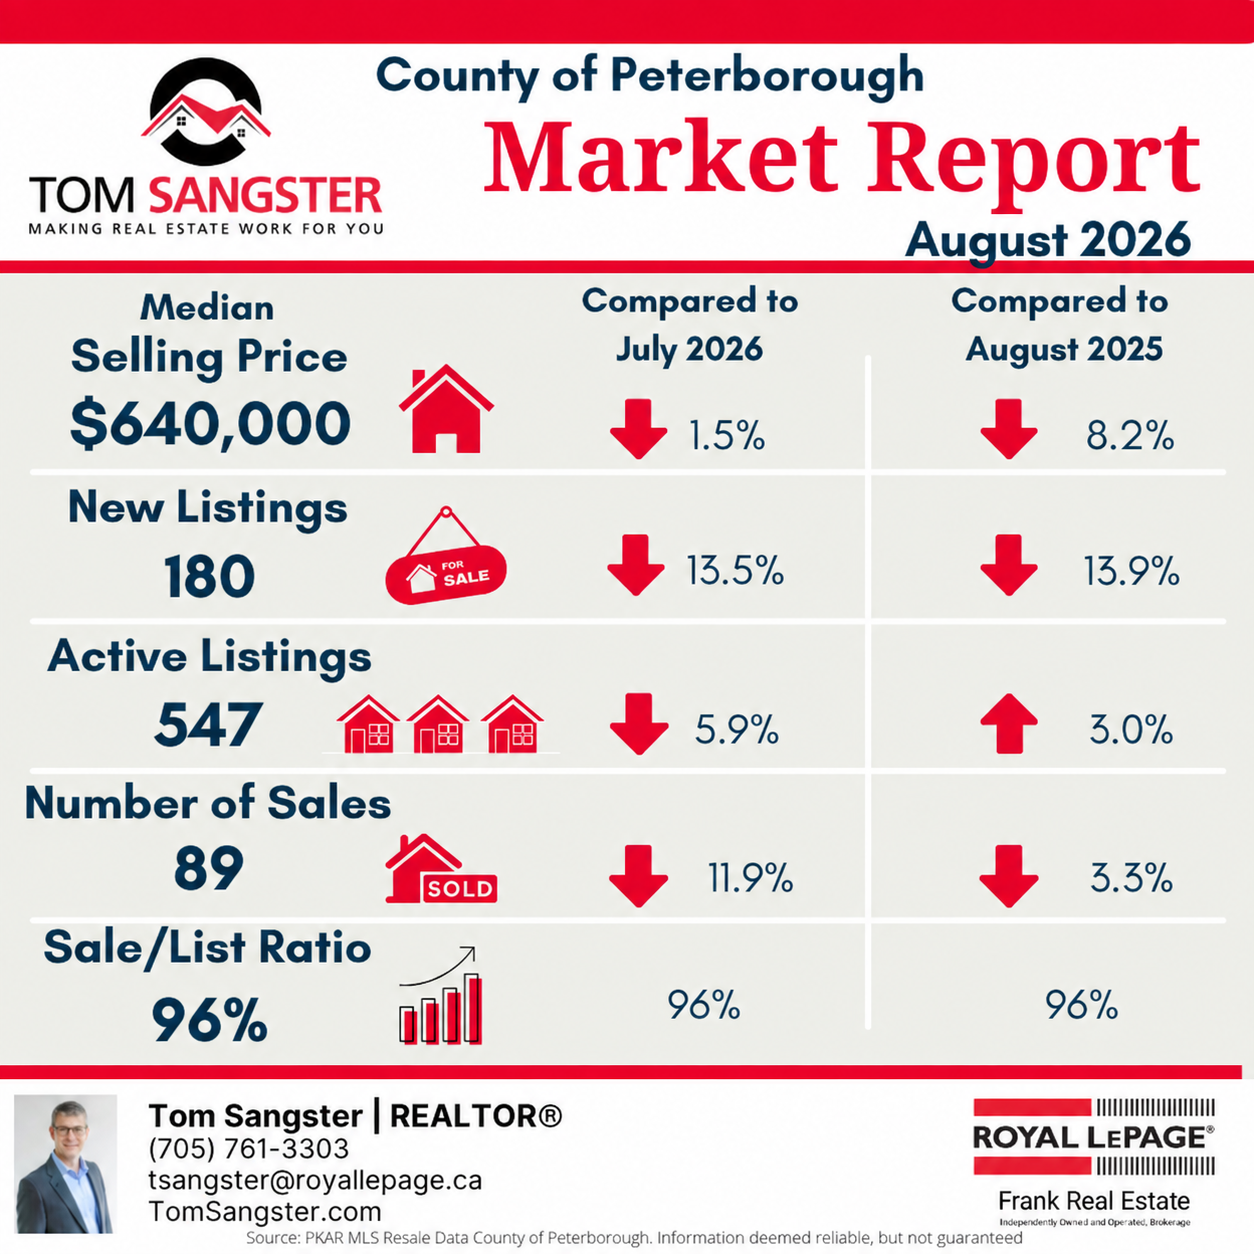
In Peterborough County, the August median selling price was $640,000, down 1.5% from July and 8.2% compared to August 2025.
Sales totalled 89, down 11.9% from July and 3.3% year-over-year. New listings declined to 180, down 13.5% month-over-month and 13.9% compared to last August.
Active inventory also eased, falling to 547, down 5.9% from July. However, that is still 3.0% higher than August of last year.
Months of inventory increased to approximately 6.1 months, putting the County into buyer-market territory based on the supply-and-demand measure I use.
That does not mean sellers have lost all negotiating leverage, or that every property is declining in value. The County is a very diverse market. Location, lot size, condition, privacy, outbuildings, road access, servicing and proximity to Peterborough can all have a significant influence on value.
For buyers, the broader selection can create opportunities, particularly when a property has been on the market for some time or is competing against several similar listings.
For sellers, competition matters. Buyers have enough alternatives that they can be selective, so pricing based on current comparable sales and current competing listings is increasingly important. The average sale-to-list ratio remained at 96%, suggesting buyers continue to negotiate below asking on many transactions.
Waterfront Market
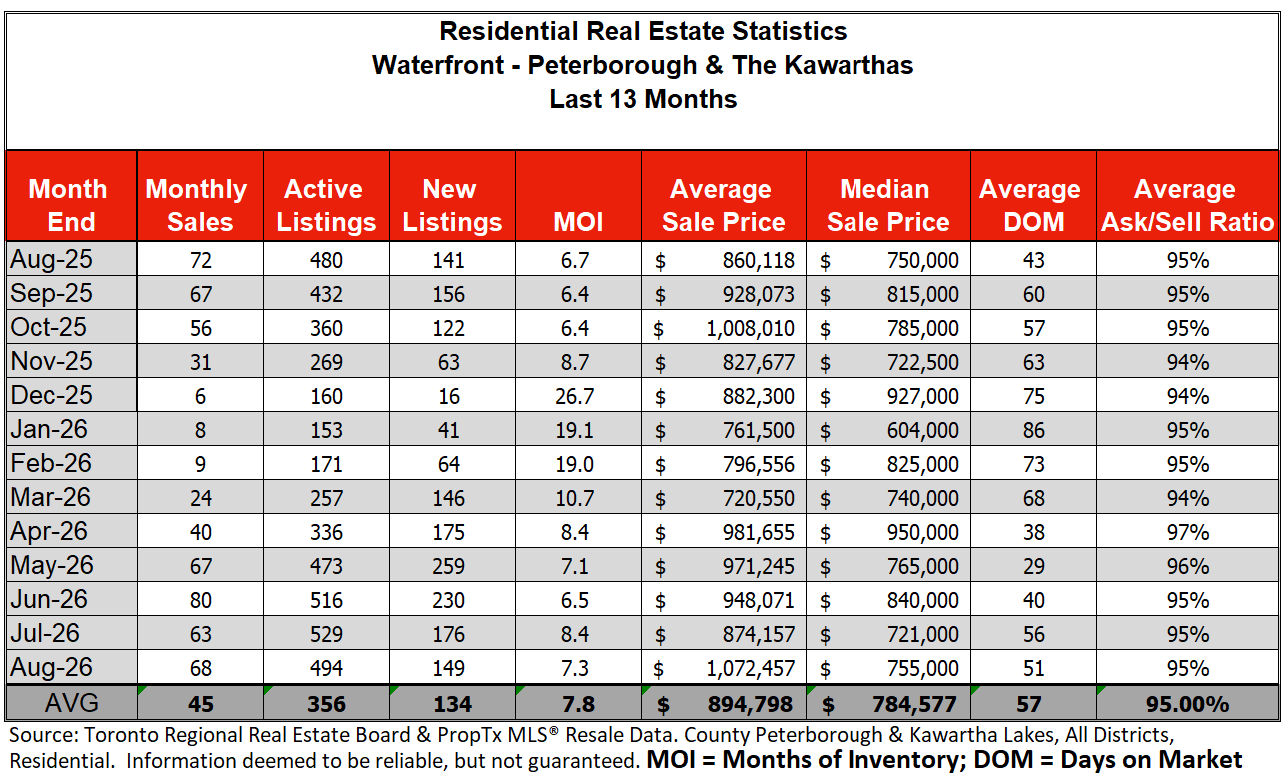
The waterfront market for Peterborough & The Kawarthas moved somewhat differently in August.
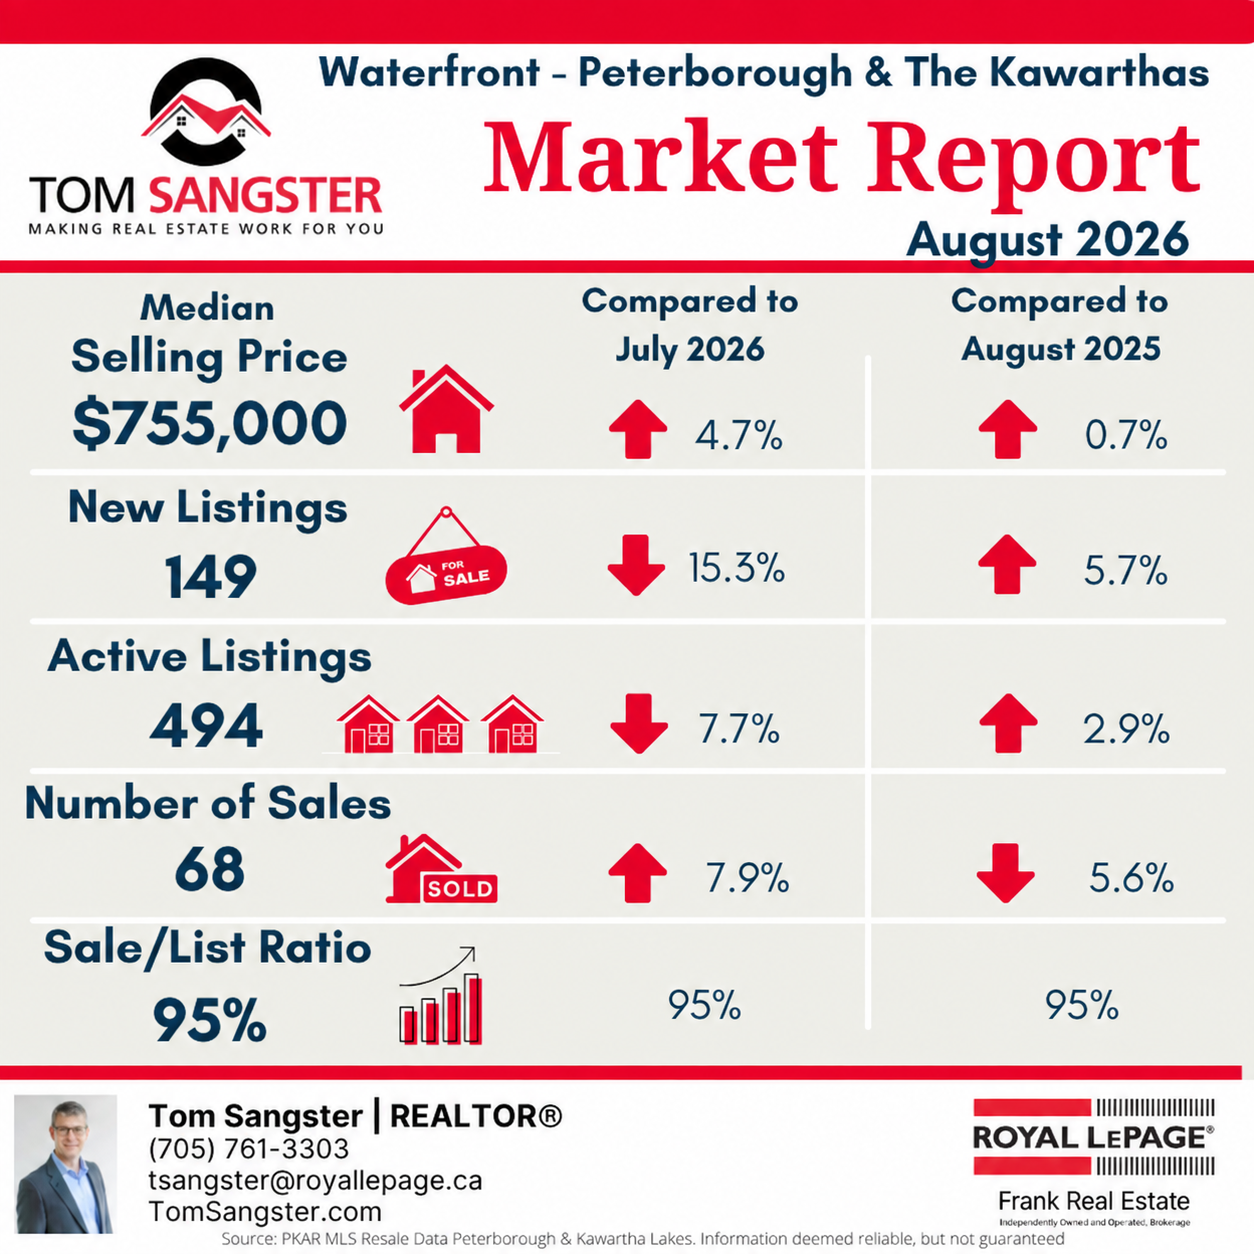
The median selling price increased to $755,000, up 4.7% from July and 0.7% compared to August 2025.
Sales also improved, reaching 68, up 7.9% from July, although still 5.6% below last August.
New listings declined to 149, down 15.3% from July but up 5.7% year-over-year. Active listings fell to 494, down 7.7% from July while remaining 2.9% above August 2025.
Months of inventory improved to approximately 7.3 months, down from about 8.5 months in July. That still represents buyer-market conditions, but the combination of higher sales and lower active inventory suggests supply and demand moved somewhat closer together during August.
For waterfront buyers, there continues to be meaningful choice. That makes careful comparison especially important because waterfront value is highly property-specific. Lake, shoreline, water depth, exposure, road access, privacy, condition, servicing and the usability of the waterfront can matter as much as the cottage itself.
The increase in the August median price should also be interpreted carefully. Waterfront sales can vary considerably from month to month depending on the mix of properties that happen to sell. A few higher-value transactions can materially change the median without indicating that every waterfront property has appreciated.
For sellers, buyers remain selective. The average sale-to-list ratio was 95%, and average days on market were 51 days. Well-positioned waterfront properties are still selling, but buyers generally have enough choice to compare value and take their time.
What This Means for Buyers and Sellers
The August numbers point to a market where the balance of power depends increasingly on the property and location.
For City buyers, the sharp reduction in sales and rise in months of inventory have created a more balanced environment than we saw earlier in the summer. Buyers may have more time to evaluate properties and negotiate, particularly where a listing has been on the market for a while.
For County buyers, inventory relative to demand is even higher. That can create opportunities, but rural and country properties need to be compared carefully because seemingly similar homes can differ significantly in land, location, systems, condition and overall usability.
For waterfront buyers, August showed better sales activity, but inventory remains high enough to provide considerable choice. This continues to be a market where patience and property-specific due diligence matter.
For sellers across all three segments, the message is fairly consistent: buyers are active, but they are selective. Pricing above the market and hoping buyers will eventually catch up is a riskier strategy when buyers have alternatives.
The biggest takeaway from August is that the Peterborough & Kawarthas market is not moving in one direction. The City has become more balanced, the County is showing buyer-market conditions, and waterfront activity improved even though inventory remains elevated.
Understanding where your specific property fits within that market is far more useful than relying on a single average or headline statistic.